Archive
Arachne, online database for archaeology
“ARACHNE is the free [account creation required] object database of DAI and the Institut of Classical Archaeology in Cologne. It provides more than 1 Million images of finds, architecture and excavations with meta information as well as digitised historical literature” (http://www.ariadne-infrastructure.eu/Services/Online-Services: Find more information and help on this page). Example of Advanced Search start choice page: 
Continue with Einzelmotive (singular motifs) (gets you back into an English interface also – the field-specific explanation on the right certainly helps): 
There is auto-search completion/suggestion, however, it seems to work only for German, and very eclectic: 
")
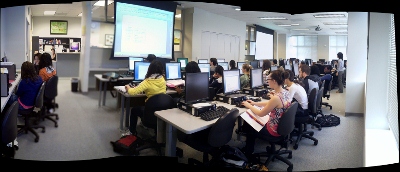
Beats having to plaster your surroundings with photos for making your own panoramas. ![]()
Mapping of Language Student Locations using PowerView
- What do our language students call home? Based on a pivot-table that counts zip codes, let PowerView tell you, which is can now distributed as a free add-in for Excel 2013 Prof, but you need to enable it (under File / Options / Add-Ins).

- Comes with a nifty zoom:


- Click, then Hover a data bubble for more info;

- Like with Bing Maps Visualization, the weighting is surprising:


Mapping of Language Student Locations using Bing Maps
- What do our language students call home? Based on a pivot-table that counts zip codes, let Bing Maps tell you, a default add-in easily accessible in the insert section of the ribbon:

- Note a Limitation: Bing Maps max 100 data points.

- So we limited to zip codes with at least 15 students (which returns just below 100 zip codes).
- Also note, the Bing maps app cannot be increased beyond a certain size (below is the maximum).

- Finally, note that the visualization does have a weight indicator, but it seems imperfect:


- Here is how data (type) input errors get handled (duplicates override the original):

- Fix your data, the reload from the upper right unfoldable menu:


- Voilà:


Voyant-tools.org

Neat encounter at the ThatCamp2013 Digital Humanities Unconference at UNCC today. Certainly a simplification over Wordsmith tools. That’s all the reviewing I have time for right now. ![]()
Meta-search many historical German dictionaries and encyclopedias using Woerterbuchnetz.de
A meta-search by the University of Trier Center for Digital Humanities may not teach you much German – you need to know it already –, but help prevent you remaining a “one-dimensional man”.

I came to know a lot of those during my own German and history studies a long time ago – – when they still only existed on paper, if not parchment ![]() . Gotta love Digital Humanities, and find other activities for physical exercise. Her is an example search result:
. Gotta love Digital Humanities, and find other activities for physical exercise. Her is an example search result:

Easy adding and viewing GeoTags with your phone camera
- “Open your camera app, go to “Settings” (sprocket), menu item: “Geotagging”, “On”:

- Turning the phone’s the GPS on is not absolutely necessary, as this indoor basement shot proves:

- but will likely increase the accuracy of the Geotag in your photo greatly:

- How to view depends on your photo viewer application, above examples are taken from the free Windows Live Photo Gallery.


Collaborative timeline activity for face-to-face classes on history
- An easily produced and repeated classroom activity, originally developed for listening comprehension and speaking practice in language classes, based on filling out collaboratively a timeline spreadsheet in the digital audio lab:
- Listen and process/write:
- Advanced German class listens to segments of an authentic German cultural history documentary from the authentic German TV series “100 deutsche Jahre” (which follows a single topic throughout 20th century German history).
- And each student enters notable summaries of events with their time of occurrence into a spreadsheet
- that the teacher
- has at beginning of activity distributed to each individual student using the digital audio labs file management features
- and after listening collects from students, merges, either with student author data or an anonymous student identifier (for corrections), into an excel timeline spreadsheet
- and visualizes the collaborative outcome as an easily collated timeline on the projector to the entire class.
- Speaking: Discuss!
- Identify what are the gravity points for the comprehension of the video by the class: Why are these events deemed important?
- What are the outliers? Criticism? Justification?
- Also correct language errors in the student output.

- In early 2006, there was no Excel web app – collaboration likely has become simpler now
- launch link to publically editable spreadsheet to class
- visualize using excel web app charts
- In early 2006, there was no Excel web app – collaboration likely has become simpler now
- Listen and process/write:


Questions? Read the About. Or just ask me a quick Our Databases: Resources with calendars -- Language learning material Moodle Sites, multimedia files -- films


FAQs for LRC student staff or for students or for teachers. To search our FAQs, in the browser addressbar, add after "https://plagwitz.wordpress.com/feed/?tag=faqs+/" "+TAG1" (from tag cloud below) OR "https://plagwitz.wordpress.com/feed/tag=faqs
&category_name=" "CAT1" (from category hierarchy below). OR search both categories and tags, and multiple TAGs/CATs (connect with "," for OR-search, with "+" for AND-search), like so: https://plagwitz.wordpress.com/feed/?tag=TAG1+TAG2+...TAGn&category_name=CAT1
+CAT2+...CATn"
Other ways to find help
If you cannot find it here, look there: 5,500 Language-Learning Links and Programs for learning or teaching 150 languages
Shortcuts:Our Lists, Our Maps, LRC Staff Moodle Site,LRC Project Moodle Site, 49erexpress, UNCC Moodle, Student Recordings: s:claslcslrcsanakostudent
Learning usage samples: Sanako oral exam, Kaltura webcam presentation, Dictation with speech recognition, Sanako written exam, Chinese and Japanese interactive stroke-order practice
Test the Sanako Installer, Webbrowser Popup Konfigurator for XP, or Windows7, faster LRC TeacherPC Log-in Let MS facilitate diacritics writing by installing for you US-International keyboard layout
This is my personal blog (Google+). The views expressed on these pages are mine alone and not those of my employer. The information in this weblog is provided “AS IS” with no warranties, and confers no rights.
