Archive
Archive for the ‘Analytics’ Category

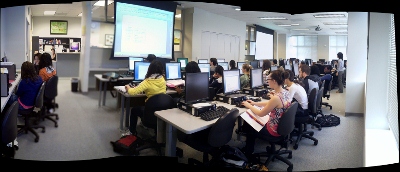
Summary of the LRC main classroom use in year 2012/3
2013/06/22
Leave a comment

(Tentative while experimenting with Calendaranalytics).
Summary of my work calendar in year 2012/13
2013/06/22
Leave a comment

(Tentative while experimenting with Calendaranalytics).
Categories: Analytics, Charts, Metrics, reports, Visualizations
calendaring, ms-calendaranalytics
First results with MS-Calendar Analytics for learning center management
2013/06/22
Leave a comment
- You can use the controls on the right to drill into the detail by selecting one or more
- Aliases,
- Attendees,
- Time periods
- Status.
- The graphs on the left and in the center will automatically reflect your selection on the right.
- These results lead to more questions. E.g. why is this tripod so popular?

-
Lesson learnt: Now it comes back to haunt us that we block broken or MIA equipment from users attempting to book it by making it look “busy” with an 24/7 “Appointment“. However, It should however be possible to filter out such appointments, versus “meeting requests”.
-


2012/3 enrolment per language in the main LRC constituent departments (LCS and ELTI)
2013/01/24
Leave a comment

Protected: Timesheets Pivot Table
2012/03/13
Enter your password to view comments.
Categories: Analytics, Metrics, service-is-hr-managing, Spreadsheets
excel-web-app

Questions? Read the About. Or just ask me a quick Our Databases: Resources with calendars -- Language learning material Moodle Sites, multimedia files -- films


FAQs for LRC student staff or for students or for teachers. To search our FAQs, in the browser addressbar, add after "https://plagwitz.wordpress.com/feed/?tag=faqs+/" "+TAG1" (from tag cloud below) OR "https://plagwitz.wordpress.com/feed/tag=faqs
&category_name=" "CAT1" (from category hierarchy below). OR search both categories and tags, and multiple TAGs/CATs (connect with "," for OR-search, with "+" for AND-search), like so: https://plagwitz.wordpress.com/feed/?tag=TAG1+TAG2+...TAGn&category_name=CAT1
+CAT2+...CATn"
Other ways to find help
If you cannot find it here, look there: 5,500 Language-Learning Links and Programs for learning or teaching 150 languages
Shortcuts:Our Lists, Our Maps, LRC Staff Moodle Site,LRC Project Moodle Site, 49erexpress, UNCC Moodle, Student Recordings: s:claslcslrcsanakostudent
Learning usage samples: Sanako oral exam, Kaltura webcam presentation, Dictation with speech recognition, Sanako written exam, Chinese and Japanese interactive stroke-order practice
Test the Sanako Installer, Webbrowser Popup Konfigurator for XP, or Windows7, faster LRC TeacherPC Log-in Let MS facilitate diacritics writing by installing for you US-International keyboard layout
This is my personal blog (Google+). The views expressed on these pages are mine alone and not those of my employer. The information in this weblog is provided “AS IS” with no warranties, and confers no rights.
